 Introduction to FreePint's Research into Visibility
Jinfo Blog
25th March 2015
Abstract
Robin Neidorf presents an introduction to FreePint's recent research into visibility. She looks at areas such as respondents' involvement in technology-related decisions that may affect information visibility, budgets for resource discovery and what the information managers polled think of when discussing "visibility".
Item
![]() At the start of the FreePint Topic Series "Making Information Visible", I posed a basic question: What is visibility? In that article, I described the challenge of supporting information managers with their objectives around making sure that users find and use the right information at the time of need.
At the start of the FreePint Topic Series "Making Information Visible", I posed a basic question: What is visibility? In that article, I described the challenge of supporting information managers with their objectives around making sure that users find and use the right information at the time of need.
Some organisations perceive the challenge of visibility as being largely about technology. Others focus instead on user training and awareness.
Three Essential Areas
FreePint's own perspective, after working with and discussing the issue with a wide range of customers, is that three overlapping areas need to be addressed for any "visibility" initiative to be successful:
- Technology
- Content
- User behaviour.
We launched a survey to better understand how information managers understand and address these three areas, with regard to their visibility efforts.
The survey was launched in January 2015, and we invited customers, Topic Series registrants and FreePint Newsletter readers to participate. We also put out the call for participation through social media and professional associations.
Cross-Sector Participation
When we closed the survey in early March, 145 information managers had participated.
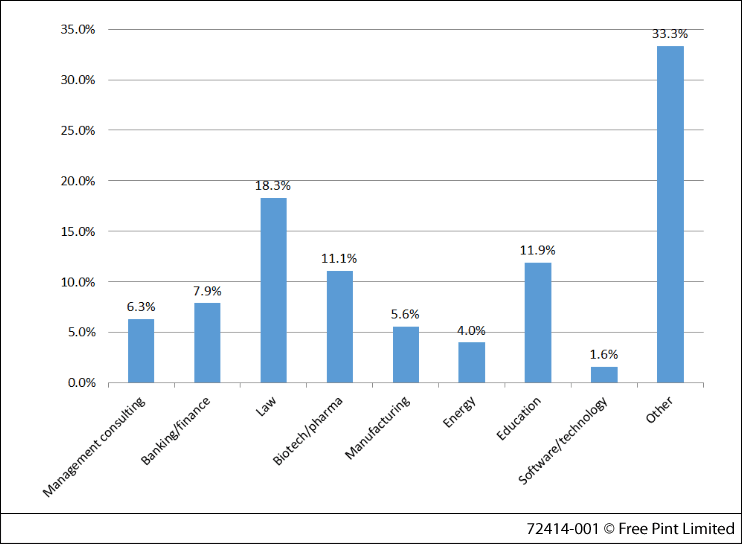
Figure 1: Industries covered by respondents of the survey
Figure 1 shows the range of industries covered by the respondents of the survey. Under "Other", representative industries include:
- Accounting
- Architecture and Engineering
- Government
- Healthcare
- Insurance
- Not-for-profit
- Publishing
- Research.
Varying Information Centre Set-Ups
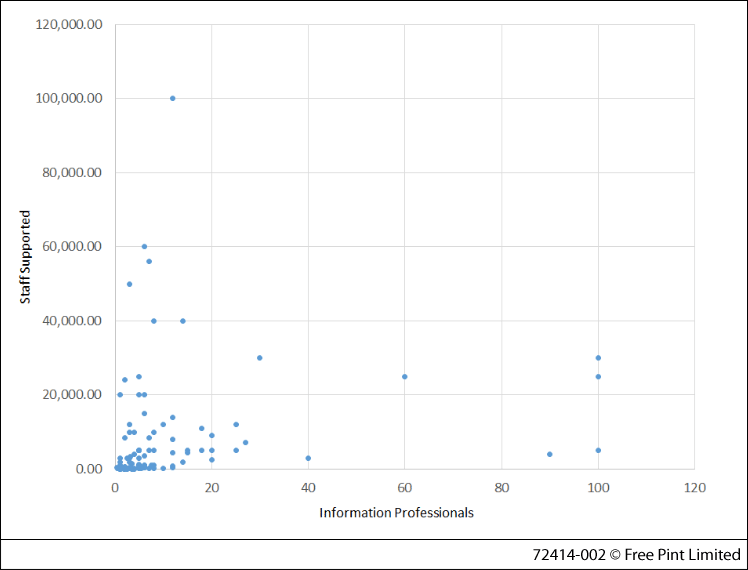
Figure 2: Relative sizes of information staff to supported staff
We asked respondents how many staff members they have in their information department, library or equivalent. We also asked how many members of staff those information professionals support. 112 respondents provided valid data for both questions, enabling us to create a scattergram of relative sizes of information staff to supported staff. This is shown in Figure 2.
The average number of staff in information centres for this set of data is 10.48, and the median is 5. The average number of supported headcount is 7,625.78, and the median is 1,650.
We asked respondents if they support staff on a global or regional basis. The respondent pool was just about evenly split between the two options.
Involvement in Technology-Related Decisions
We asked respondents how involved they are in technology-related decisions that may affect information visibility. They could select from the following choices:
- Very involved - I help make the decision
- Somewhat involved - I am asked for input into decisions
- Slightly involved - I learn about decisions as they are being made
- Not involved - I learn about decisions after the fact
Their responses are shown in Figure 3.
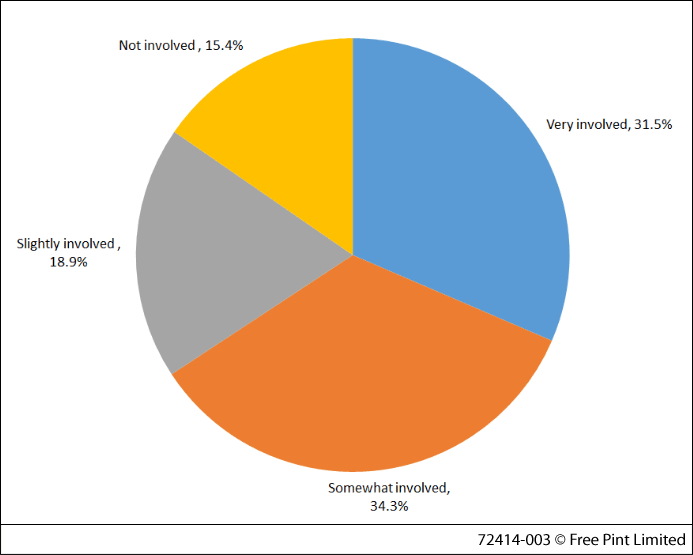
Figure 3: Involvement in technology-related decisions
Budget for Supporting and Improving Visibility
Finally, we asked if they have any budget that is or could be used towards supporting or improving visibility, and the answer options were as follows:
- Yes, currently used towards resource discovery
- Yes, but not currently used towards resource discovery
- No, budget for this would be managed in this area of the business:
Their responses are shown in Figure 4.
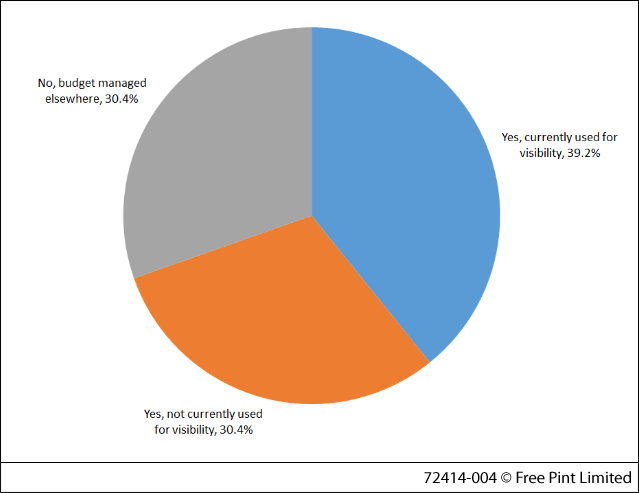
Figure 4: Do you have any budget that is or could be used towards supporting or improving visibility?
Among the "other" parts of the business that might manage this budget were named:
- Accounting
- Administration (2 repondents)
- Banking/finance (2 respondents)
- Collection development
- Communications (2 respondents)
- Corporate strategy (3 respondents)
- IT (12 respondents)
- Intranet team
- Knowledge services (2 respondents)
- Marketing
- Partner group
- Shared services.
Several respondents commented that they weren't sure where in the business this would sit, and two commented that there is no formal budgeting process and any projects like this would be determined on a case by case basis.
What is Visibility?
We asked respondents what they mean by "visibility". This was an open-ended question that respondents could complete however they wanted. The word cloud in Figure 5 provides an initial view of what concepts come up when information managers think of visibility. We'll provide a more detailed analysis of their answers later in the survey report.
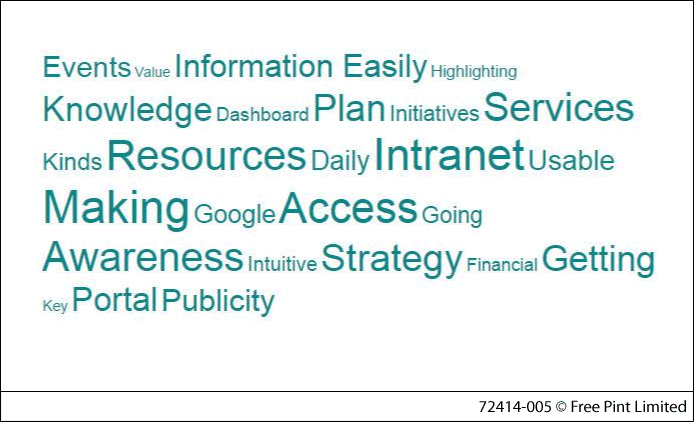
Figure 5: Information managers' views on visibility
Questions and Analysis
The survey was divided into three parts to cover current environment, emerging needs and attitudes around technology, content and user behaviour. In each of the following chapters, we examine one of these three areas in detail followed by a section on overall strategy and success.
In-depth analysis can be found in the following FreePint Subscription Articles:
- Results from FreePint Research into Visibility Part 1 - Tools and Technologies
- Results from FreePint Research into Visibility Part 2 - Content
- Results from FreePint Research into Visibility Part 3 - User Behaviour
- Results from FreePint Research into Visibility Part 4 - Strategy and Success
Full report (PDF) contains all of the above content, in a convenient package for reference and sharing:
This Blog Item is part of the FreePint Topic Series "Making Information Visible".
- Blog post title: Introduction to FreePint's Research into Visibility
- Link to this page
- View printable version
![]() Related articles:
Related articles:
- Results from FreePint Research into Visibility Part 3 - User Behaviour
Tuesday, 31st March 2015 - Results from FreePint Research into Visibility Part 2 - Content
Monday, 30th March 2015 - Results from FreePint Research into Visibility Part 1 - Tools and Technologies
Friday, 27th March 2015 - What Does it Take To Do Visualisation Well?
Tuesday, 24th March 2015 - Evolve Your Search Into Solve - Stop the Seven Deadly Sins
Tuesday, 3rd March 2015 - Eight Steps to Good Management for Visible Information
Tuesday, 3rd February 2015 - Taking the Mystery Out of Big Data - Moving from Data Collection to Competitive Actions
Monday, 2nd February 2015 - What is Visibility?
Tuesday, 6th January 2015
![]() Related Blog items:
Related Blog items:
- Tools that Take Us Beyond Search and Retrieval
Friday, 27th February 2015 - Defining Barriers and Opportunities in Visibility - Preliminary Survey Results
Tuesday, 24th February 2015
![]() Related reports:
Related reports:
- FreePint Report: Research into Visibility 2015
Monday, 13th April 2015
Register for our next Community session:

AI use cases
22nd September 2026
Latest on our YouTube channel:
Read on the Blog:
July 2026 update
1st July 2026
- Content and AI – key findings from Jinfo's recent research
21st July 2026 - Vendors and AI – integration is creating a new opportunity for aggregators
9th July 2026 - July 2026 update
1st July 2026
- From AI use cases to implementation (Community) 22nd October 2026
- AI use cases (Community) 22nd September 2026
- Stakeholder value and AI: Workshop (Community) 16th July 2026